Customer Questions Analysis for Small Teams: Templates, Faster Fixes
Analyze customer questions with copyable templates, a low effort workflow from manual review to AI, and a one page priority plan for faster action.

Customer questions analysis is the practice of collecting what customers ask and say, then systematically turning that text into prioritized fixes and product decisions. The immediate next step is simple: pull every question, ticket, and comment into one place before you try to analyze any of it. From there, you can apply tested frameworks like AHRQ’s survey guidance and topic-level sentiment coding to find what actually moves the needle.
TL;DR:
- Export tickets, chats, search logs, surveys, and product questions weekly or monthly; retain raw wording and tag each entry with its source channel.
- Keep web surveys near 10 minutes, pair NPS with an explanation prompt, and place questions about what happened, how, and how it felt after ratings.
- Manually code fewer than a few hundred monthly responses; add keyword sorting with human review as volume grows, then use AI when those methods lag.
- Code sentiment by topic, not by whole response; a study of 5,356 app reviews found that tagging specific issues exposed problems overall scores missed.
- Rank themes by frequency, effect on NPS or CSAT, and effort to fix; assign an owner and deadline to every top issue.
Table of Contents
- Why analyze customer questions and feedback now
- What to collect and where: building a single source of truth
- Question templates that get usable answers
- How to turn open-ended responses into themes you can act on
- Metrics that connect feedback to business outcomes
- Turning themes into decisions: prioritization and reporting
- Research-backed practices worth adopting
- A pragmatic rollout path for small teams
- Capturing visitor questions automatically with a site assistant
- FAQ
- Sources
Why analyze customer questions and feedback now
Collecting feedback and analyzing it are different jobs. Collection fills an inbox. Analysis turns scattered comments into a ranked list of fixes your team can actually schedule.
Done well, this work pays off in several concrete ways. Repeat purchase improves when you close the gap between what customers expect and what they get. Support load drops when you fix the issues generating the most repeat tickets instead of reacting to whichever one came in last. Product roadmaps get more certain when prioritization is based on frequency and impact rather than whoever complained loudest in a meeting.
A 2025 Springer study of 5,356 app reviews found that construct-level analysis, tagging specific issues within the text, uncovered problems that sentiment scoring alone missed entirely. A review can read as “positive” in tone while still describing a broken checkout flow or a confusing return policy. Sentiment tells you how someone feels. Topic coding tells you why, and why is what you can fix.
The difference matters because teams that only track satisfaction scores often optimize for the number instead of the cause. Analysis forces you to name the specific friction point, which is the only thing you can actually act on.
What to collect and where: building a single source of truth
Customer questions show up in more places than most teams track. Pulling them into one pipeline, rather than leaving them scattered across inboxes, help desks, and spreadsheets, is what makes analysis possible at all.
Channels worth including, and why each one matters:
- Support tickets: show the problems serious enough that someone stopped to ask for help.
- On-site or in-product Q&A: often surfaces gaps in your own documentation before a ticket ever gets filed.
- Search logs: reveal what people are looking for on your site even when they never ask anyone directly.
- Post-purchase and NPS surveys: capture structured signals you can trend over time using a Customer Experience Agency UK | NPS & CX Research | Skopos for expert support.
- Live chat and chatbot transcripts: contain unfiltered, real-time phrasing that tells you how customers describe problems in their own words.
Solicited feedback, the kind you ask for through a survey, is structured and easy to compare over time. Unsolicited feedback, like support tickets or chat questions, is messier but often more honest because nobody prompted it. Mixing both gives you a fuller picture: solicited data tells you how satisfaction trends, unsolicited data tells you what is breaking right now.
To build the pipeline without overengineering it, export conversations and tickets into a shared spreadsheet or lightweight database on a weekly or monthly cadence, tag the source channel on every entry, and keep raw text intact rather than summarizing at the point of collection. Keeping chat logs rerunnable rather than pre-filtered, as described in this guide to chat transcript analysis, means you can reanalyze old conversations with a new coding framework later without re-collecting anything.
Pro Tip: Tag every piece of feedback with its source channel at the moment you collect it. Retrofitting that metadata later is far slower than adding one column up front.
Question templates that get usable answers
The right question type depends on what you’re trying to learn. AHRQ’s survey guidance notes that a well-built survey mixes usage and context questions, satisfaction ratings, behavioral-intent questions, and an open-ended prompt, and that average web-based survey burden runs about 10 minutes.
Templates worth copying directly:
- “How often do you use [product/service]?” (usage and context)
- “What were you trying to accomplish when you used [feature]?” (context)
- “How satisfied are you with [specific aspect]?” (satisfaction)
- “How likely are you to recommend us to a friend or colleague, on a scale of 0 to 10?” (NPS-style)
- “How likely are you to purchase from us again?” (repurchase intent)
- “What almost stopped you from completing your purchase today?” (friction detection)
- “What’s one thing we could improve about [experience]?” (improvement priority)
- “What happened, step by step, when you ran into this issue?” (structured open-text)
- “How did that make you feel about using our product going forward?” (open-text, emotional layer)
- “Compared to other options you considered, what stood out about us?” (competitive context)
For open-ended prompts, asking what happened, how it happened, and how it felt produces more usable narrative than a generic “any comments?” box, a sequencing approach AHRQ’s elicitation guidance documents in detail.
Keep web surveys near that 10-minute target. Shorter micro-surveys with a few questions right after a support interaction or purchase work well for catching moments in context. Save longer periodic surveys, covering satisfaction trends and competitive positioning, for quarterly check-ins rather than every transaction. Place the open-ended follow-up last, after the rating questions, so it captures reasoning rather than becoming the entire burden.
How to turn open-ended responses into themes you can act on
Raw text is only useful once it’s coded into categories you can count and compare. The workflow scales with your volume.
Start by reading responses straight through, without a framework, and let top-level categories emerge naturally, things like “pricing confusion,” “shipping delays,” or “feature discovery.” Write a definition and a few real examples for each category before you code anything else. This becomes your coding framework.
From there, three processing paths fit different volumes:
- Manual coding: works well under a few hundred responses a month, where one person can read and tag everything by hand.
- Semi-automated: uses keyword scaffolding (search for recurring words or phrases) to pre-sort responses, with a human validating and correcting the output before it’s final.
- AI-based tagging: fits high-volume operations where manual review alone can’t keep pace.
Whichever path you choose, sentiment has to be measured at the topic level, not the overall response level. A single comment can be frustrated about shipping and genuinely happy about product quality at the same time. Tagging sentiment to the overall message flattens that nuance and tells you nothing useful. The Springer construct-level study found that this kind of granular tagging surfaced specific product issues that overall sentiment scoring missed completely.
For automated or semi-automated pipelines, pull a random sample and have a human re-check the tags against your original framework. If accuracy drops below what you consider usable, tighten your category definitions before you scale the volume further.
Pro Tip: Revisit your coding framework every quarter. New product launches and seasonal issues create new categories that your original groups won’t capture.
If your team is discovering FAQ candidates straight from chat transcripts, a five-step process for pulling FAQs from chats without needing a developer covers the same coding logic applied specifically to support conversations.
Metrics that connect feedback to business outcomes
Net Promoter Score is calculated by subtracting the percentage of detractors (customers scoring 0 to 6) from the percentage of promoters (scoring 9 to 10), with scores of 7 to 8 counted as passives and excluded from the calculation, according to Dynata’s NPS guidance. NPS is directional, a single number that tracks loyalty over time, but it tells you nothing about why someone scored the way they did. That’s why the same guidance recommends always pairing the NPS question with an open-ended follow-up asking customers to explain their rating.

A second layer worth adding is measuring importance separately from satisfaction. Rice’s 2025 Customer Value Report used a stratified 3,063-person sample and randomized question order specifically to avoid the bias that comes from asking importance and satisfaction back to back. The logic: a low-satisfaction score on something customers don’t care about matters far less than a mediocre score on something they rank as essential.
A compact KPI set worth tracking monthly: theme frequency (how often each coded category appears), NPS or CSAT impact per theme (does this issue correlate with lower scores), and an ease-to-fix estimate for each top theme. Reviewed together, these measures tell you more than vanity metrics tracked in isolation.
Turning themes into decisions: prioritization and reporting
Coded themes only create value once someone decides what to fix first and tells the team. A simple prioritization matrix does that job: score each theme on frequency (how often it appears), impact (its estimated effect on NPS or CSAT), and ease or cost to fix. Themes that are high-frequency, high-impact, and low-effort go to the top of the list.
A one-page brief keeps this readable for stakeholders who don’t have time to dig through raw data:
- The leading themes, ranked by the prioritization matrix.
- A selection of representative, anonymized quotes per top theme.
- The scored matrix itself, visible as a simple table or heatmap.
- An assigned owner and deadline for each theme going into the next cycle.
| Theme | Frequency | Impact | Ease to fix |
|---|---|---|---|
| Checkout confusion | High | High | Medium |
| Shipping delay complaints | Medium | High | Low |
| Feature discovery gaps | High | Medium | High |
A heatmap view of frequency against impact makes the top-left priorities visible at a glance, and a trendline showing theme frequency month over month shows whether a fix actually worked once it ships.
Research-backed practices worth adopting
A few validated frameworks are worth building into your process rather than reinventing from scratch.
The CAHPS Patient Narrative Elicitation Protocol uses sequenced open-ended items that elicit richer, story-structured responses, and the protocol recommends using the questions together in order rather than individually.
AHRQ, CAHPS Patient Narrative Elicitation Protocol
That sequencing logic, asking what happened, then how, then how it felt, applies just as well to product feedback as it does to the health care context it was built for. Rice’s 2025 report reinforces the value of separating importance from satisfaction, using randomized assignment specifically to reduce order-effect bias in its 3,063-person sample. And the Springer construct-level analysis of app reviews makes the case plainly: sentiment-only systems miss issues that topic-and-construct coding catches.
A pragmatic rollout path for small teams
Start smaller than feels comfortable. A manageable monthly cycle of open responses can surface real patterns without drowning a small team in manual coding. Expect your first concrete wins as the process takes hold: a recurring support issue reduced, an FAQ rewritten, or a small product fix shipped.
Stay manual while volume is low. Move to keyword scaffolding once a single person can no longer read everything in a sitting. Reserve AI-based tagging for the point where volume genuinely outpaces what scaffolding and spot-checks can keep up with. Scaling the tooling before you need it just adds overhead nobody asked for.
— Konstantin
Capturing visitor questions automatically with a site assistant
Everything above depends on having questions to analyze in the first place, and most small sites never capture the ones asked silently: a visitor who can’t find a return policy and just leaves instead of emailing support. A configurable AI website assistant installed as a widget on your own site closes that gap by catching those questions as they happen.
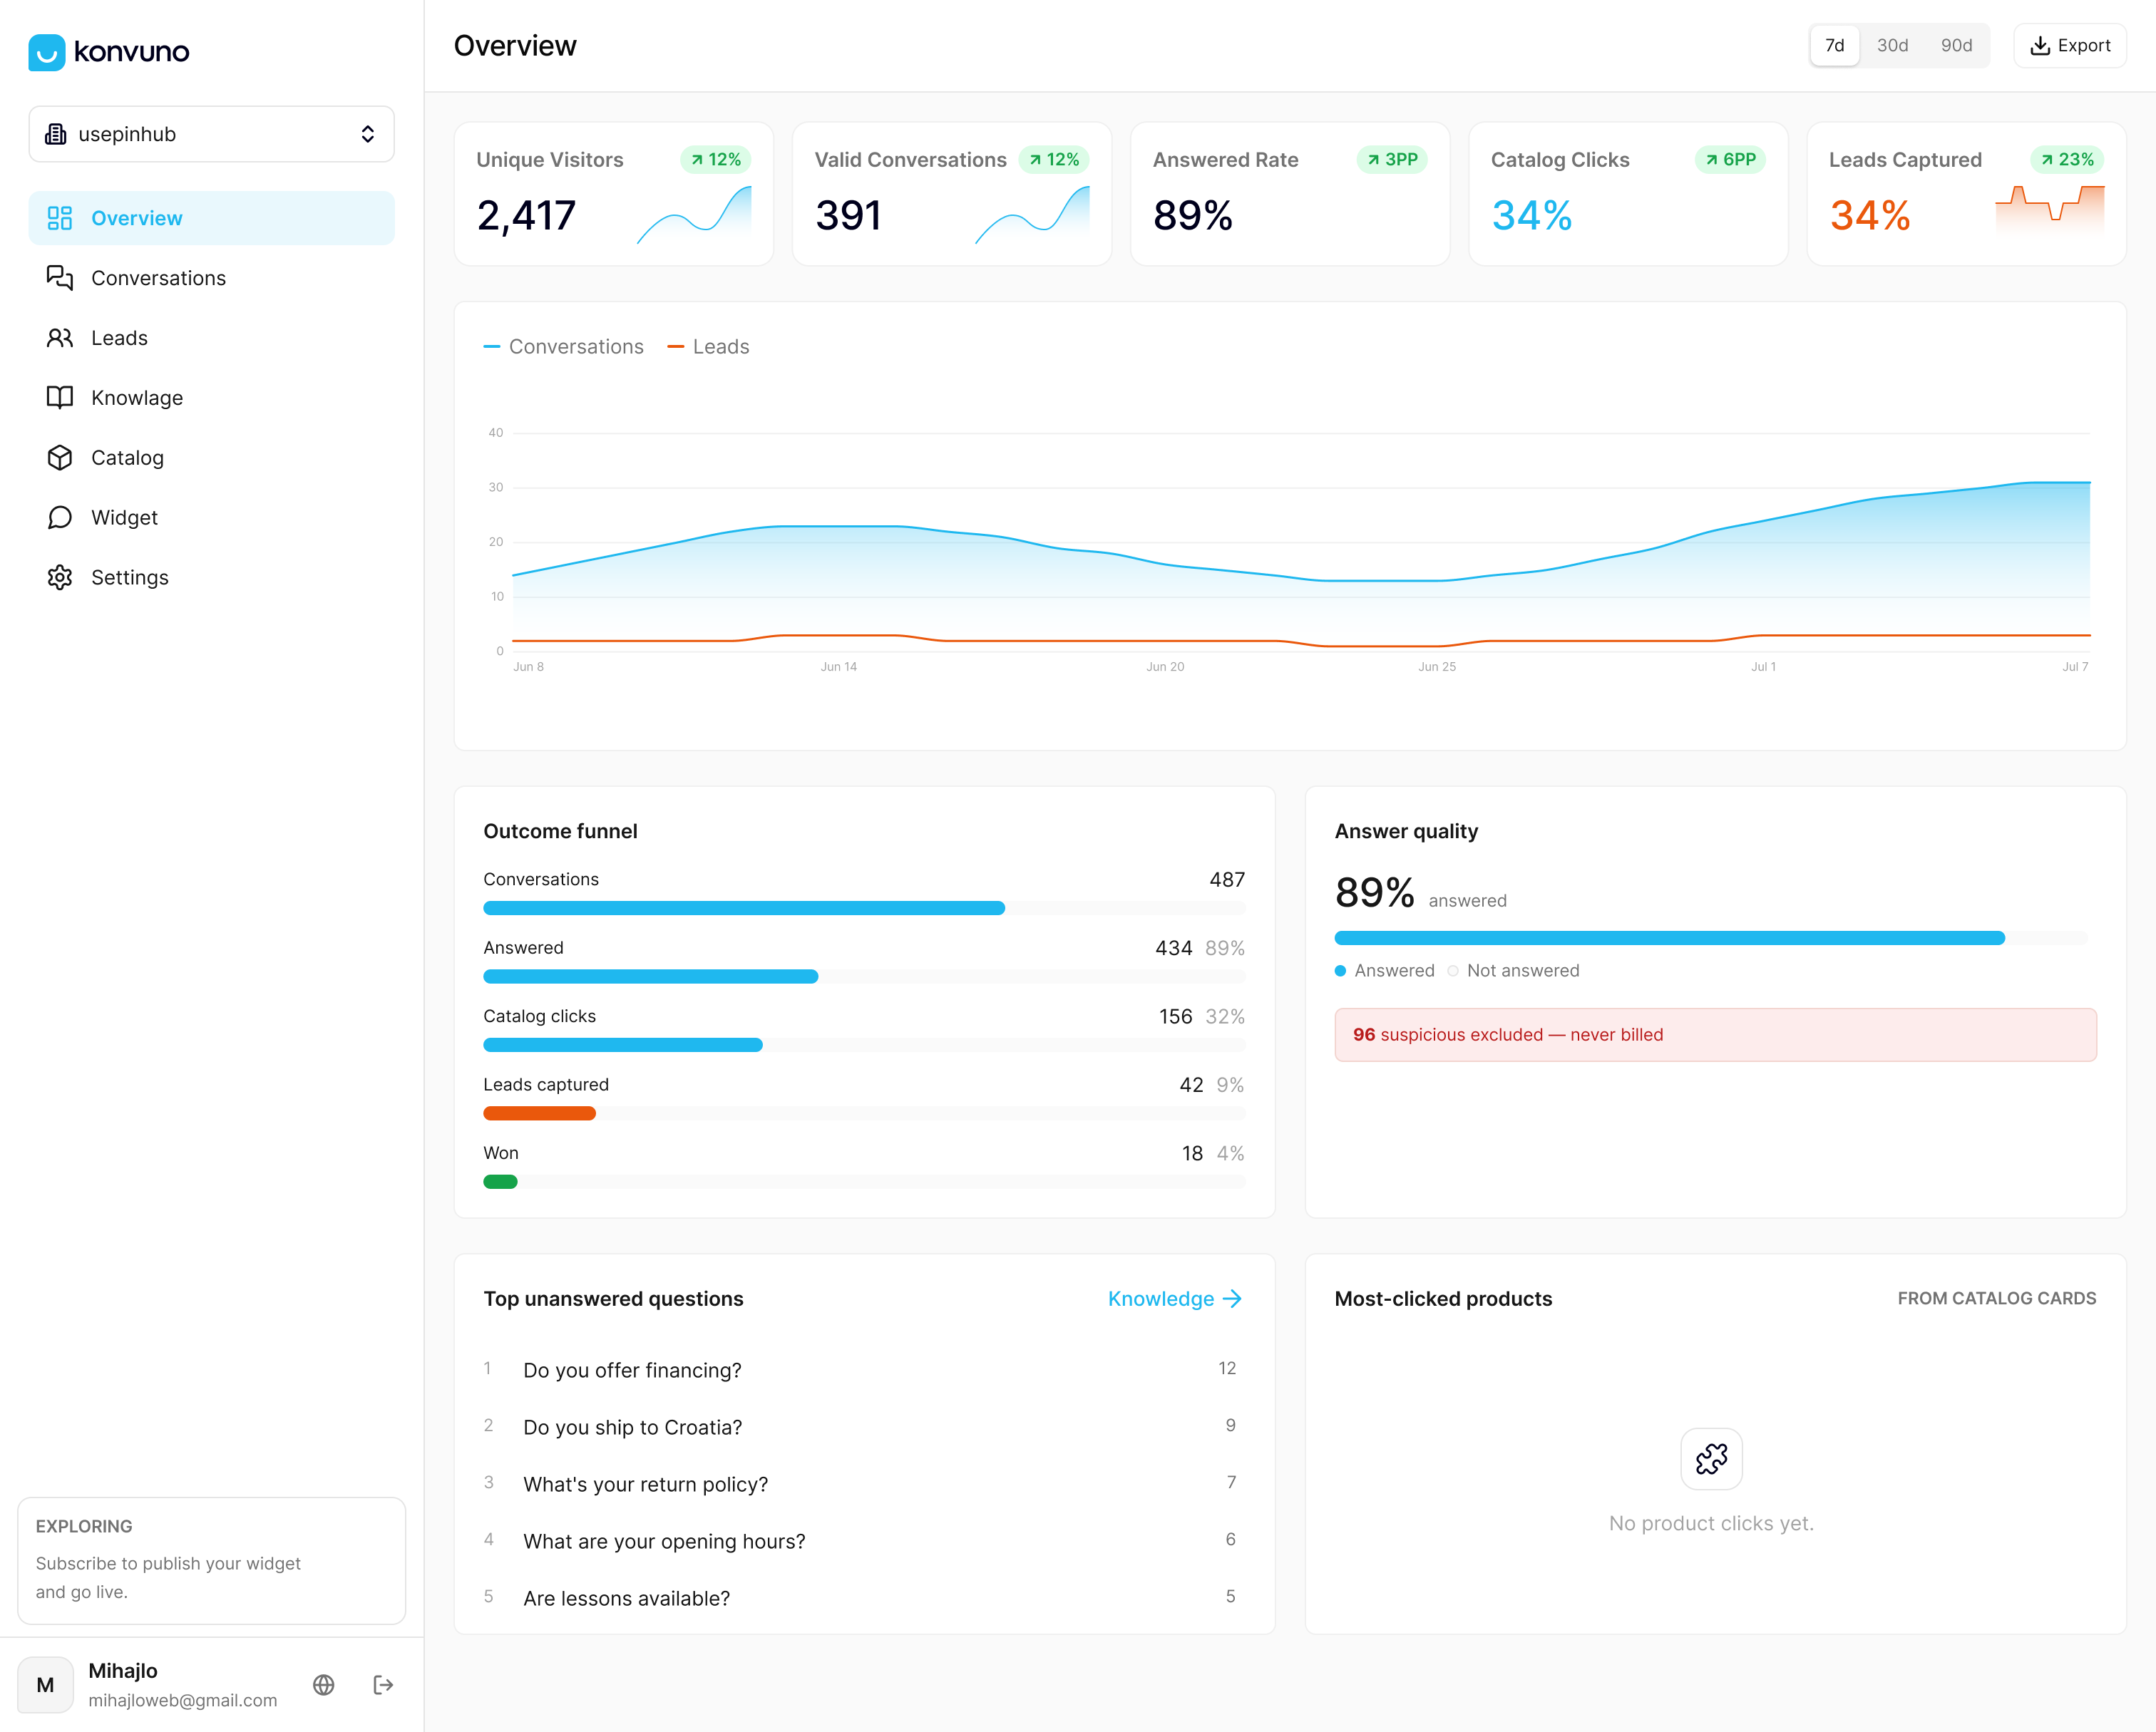
We built Konvuno around that exact problem. Install a script tag, and the assistant starts answering visitor questions directly from your existing FAQs, website content, and product catalog, with no developer involvement required. For store owners, product catalogs sync automatically from WooCommerce or any Google Merchant or Facebook product feed, so answers about price and availability stay accurate without manual updates. Every conversation gets stored and surfaced in a dashboard built for exactly the kind of analysis this guide describes: what visitors actually asked, how often, and where the gaps in your content are. When a question needs a human, the assistant hands off instead of guessing, and captured leads flow straight into a built-in CRM.
We support multiple languages out of the box, which matters if your visitor base isn’t monolingual. Plans run Starter, Growth, and Business, each letting you configure and preview the assistant before committing to anything. If you’re ready to see what questions your own site is missing, you can explore Konvuno’s plans and get the capture pipeline running in minutes.

FAQ
What are the needs and wants of a customer?
Customer needs typically split into functional needs (does the product solve the practical problem), emotional needs (how it makes them feel), and social needs (how it affects their standing with others), based on frameworks described by Harvard Business School Online. Practical surveys uncover these by asking about product use, buying experience, price and value, and future purchase likelihood.
What questions should I ask in a customer survey?
A strong survey mixes usage and context questions, a satisfaction rating, a recommendation or repurchase question, and at least one open-ended prompt, following guidance from AHRQ’s survey research. Keep the whole survey near the roughly 10-minute average burden AHRQ cites for web-based surveys to avoid drop-off.
What does consumer analysis mean?
Consumer analysis means systematically studying what customers ask, say, and do, usage patterns, stated satisfaction, complaints, and behavior, to identify patterns that inform product and business decisions. It combines structured metrics like NPS with qualitative coding of open-ended feedback to explain the numbers behind the scores.
What are 5 qualities of good customer service?
Common frameworks point to responsiveness, clarity, empathy, consistency, and follow-through as the core qualities customers notice most, drawn from satisfaction survey research that links these traits to repeat business and improvement priorities per Oklahoma State University Extension guidance. Measuring these directly in surveys, rather than inferring them from overall scores, makes them actionable.
How do I prioritize customer feedback themes?
Score each coded theme on three axes: how often it appears, its estimated impact on satisfaction or NPS, and how easy or costly it is to fix. Themes scoring high on frequency and impact but low on effort should move to the top of your next planning cycle.