The Overview screen
What the Overview shows, how to pick the period you look at, and how to read the comparison with the period before.
Overview is the first screen you see after signing in. It answers one question: is the assistant on your website doing its job? It shows how many conversations it had, how many it answered, how many visitors left their contact details, and which questions it could not answer yet.
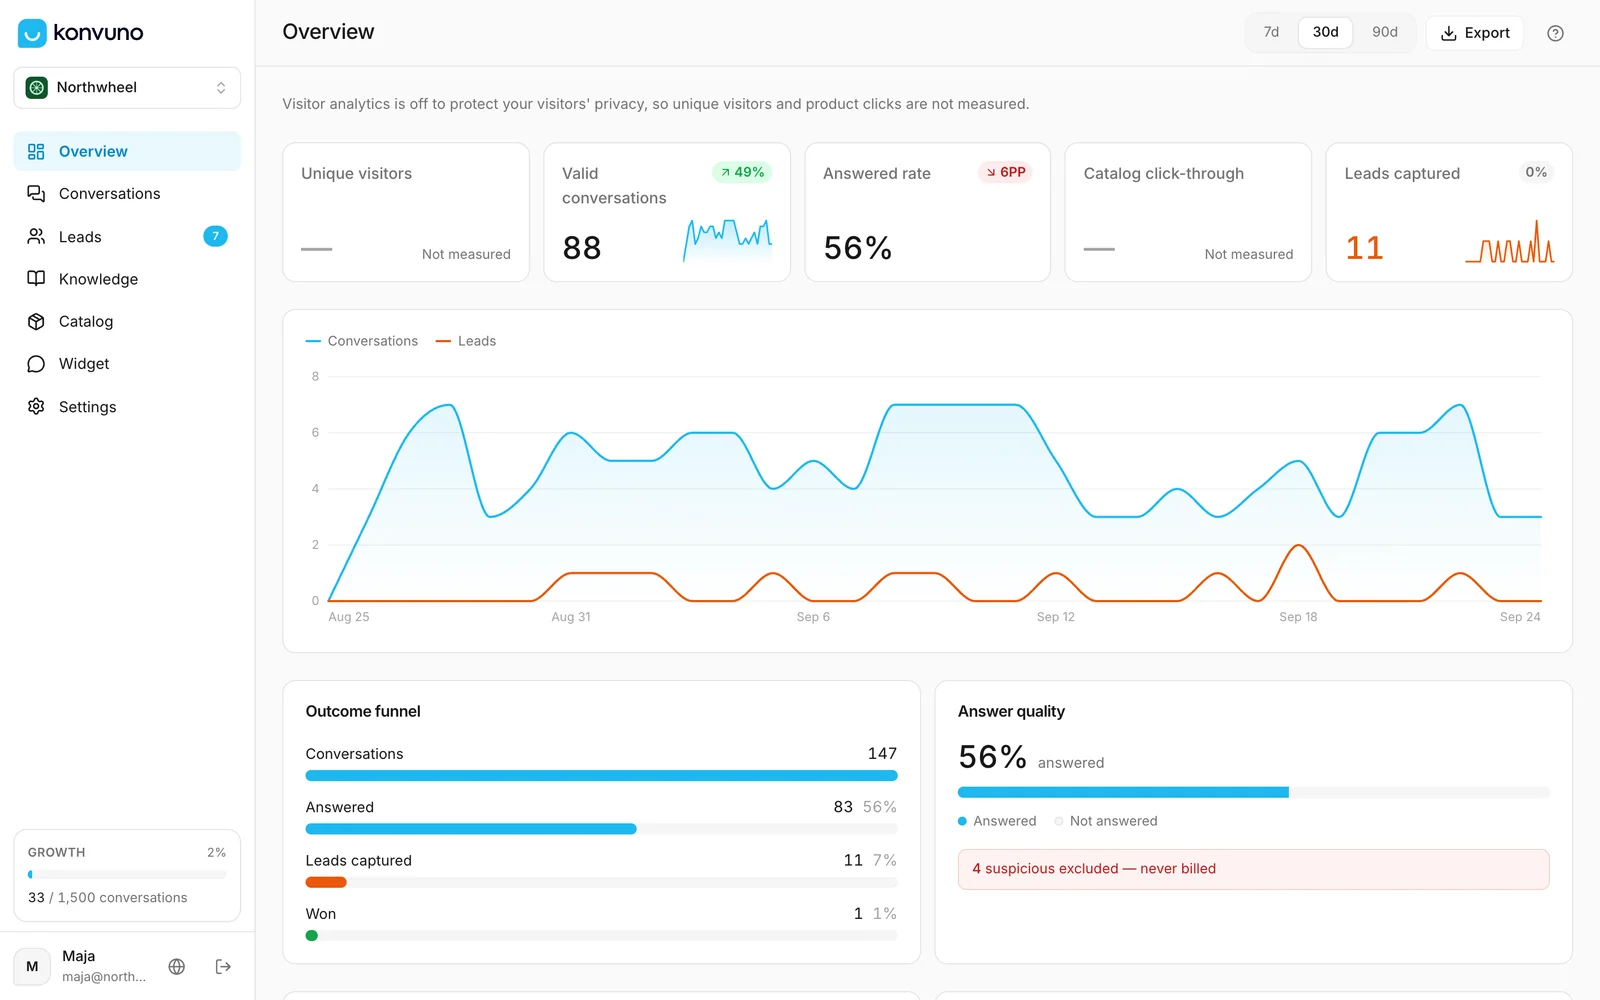
What is on the screen
From top to bottom:
- Five numbers — Unique visitors, Valid conversations, Answered rate, Catalog click-through and Leads captured. See The five numbers at the top.
- A chart of conversations and leads per day. See The daily chart and the top lists.
- Outcome funnel and Answer quality — how many conversations turned into answers, leads and customers. See The funnel and answer quality.
- Questions without an FAQ and Most-clicked products — what to teach the assistant next, and what visitors are interested in. See The daily chart and the top lists.
Everyone in your team sees the same Overview, owners and members alike.
Note
The line at the top of the screen says "Visitor analytics is off to protect your visitors' privacy, so unique visitors and product clicks are not measured." To protect your visitors' privacy, Konvuno does not record who opens your widget or which product cards they click. Unique visitors and Catalog click-through therefore show — and Not measured instead of a number, and Most-clicked products stays empty. Everything about conversations and leads is counted as usual.
Pick a period
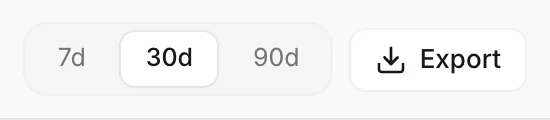
The buttons at the top right choose how far back the screen looks: 7d, 30d or 90d. Every number, the chart and the lists on the page follow your choice.
- The period always ends right now and reaches back 7, 30 or 90 days from this moment — it is not a calendar week or month.
- The screen opens on 30d every time.
- When you come back to the tab after a while, the numbers refresh by themselves.
Compare with the period before
The small badge in the corner of each number compares it with the period just before — the 30 days before these 30 days, for example. Green with an arrow up means more than before, red with an arrow down means less.
| The badge shows | What it means |
|---|---|
↗ 20% |
The number grew by a fifth compared with the period before. |
↘ 3PP |
A rate fell by 3 percentage points — for example from 20% to 17%. |
| new | There was nothing to compare with: the period before had 0 — or, for a rate, no conversations to work it out from — and this one has more. |
0% |
No change. |
A rate such as Answered rate changes in percentage points, because a percent of a percent is hard to read: going from 20% to 17% is "3 points down", not "15% down".
Note
On 90d the numbers have no badge. Konvuno deletes conversations after 90 days (see How long Konvuno keeps your data), so the period before — 91 to 180 days ago — holds nothing to compare with. For a comparison, use 7d or 30d. A business Konvuno has set up as a clinic keeps conversations for 30 days, so it sees badges on 7d only.
Before your widget is live
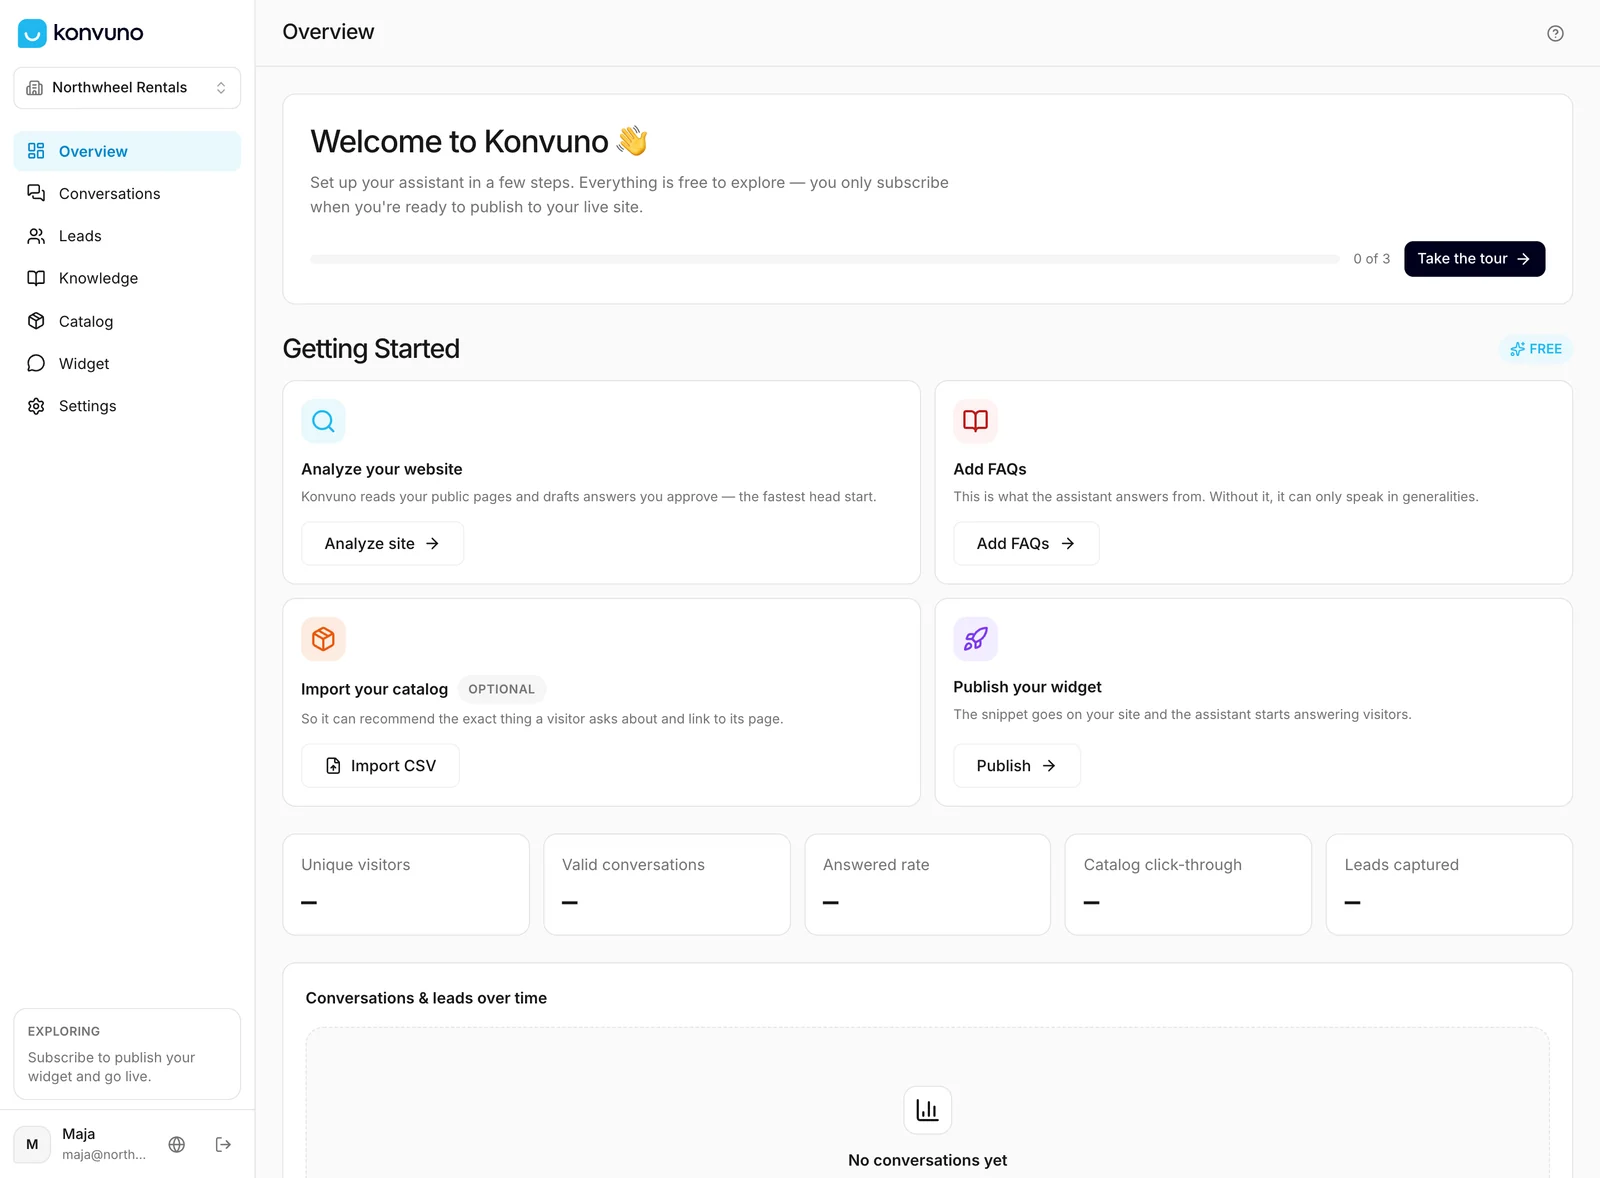
A business that has not published its widget yet, and has had no conversations, sees its setup steps here instead: Getting Started with a short checklist and a Take the tour button, and empty placeholders where the numbers will be. The numbers appear as soon as you publish the widget — from then on the screen shows real figures, including zeros for a quiet week.
How other businesses use it
- A dental clinic checks the Overview every Monday on 7d and turns the top unanswered question of the week into a new FAQ.
- A furniture shop compares 30d before and after a sale to see whether more visitors left their contact details.
- A marketing agency managing several client businesses switches between them in the sidebar and reads each one's Overview separately.
- A software company watches Answered rate after every product release to catch questions its FAQs do not cover yet.